Database Sets
Create your own data sets to display on maps.
Creating a set
Enter a name for the set in the input field and hit enter. Your set and a tab for it will get created and you will be ready to edit its details:
| Name | The name of the set is also displayed in the tabs |
| Description | Describe the data the set holds |
| Color Mode | Choose on how the data gets colored |
| Color Low | This color is used for the lowest value of the set |
| Color High | This color is used for the highest value of the set |
| Sharing | Set who can see your data (nobody by default) |
| External Data | An optional url to e.g. a google sheet |
Individual color mode
Will color each distinct value or label with an own color. If a label and a value were entered the vlaue will be used for selecting a color automatically.
Linear and Logarithmic color modes
Only numeric values can be colored using these modes. The lowest and highest value's colors can be set via the set's details. Other value's colors get interpolated. To understand how those modes' results look like it is best to enter some values and switch the modes. Use like 1, 2 ,3 ,4 ,5 ,10 ,20 ,50 ,1000, 5000 for seeing the difference easily.
Color Settings
The three sliders will set Hue, Saturation and Lightness of the color used.
Low and high values
Lowest and highest values are chosen globally at the moment = If the highest or lowest values for that set are on another map those values will still be used for coloring. If you would like a mode where low and high are calculated from the displayed systems only let me know (use the feedback forum please).
Map ownership
Currently a map is owned by the user that created it originally. Also only that user can edit the map.
Adding Data
To add data you need to load a regional map. Opening a database set's details will show all systems on that map in a table. Edit the data and watch the map display it right away. With the details open clicking a system will sort that system to top of the list and put the cursor in the value's input field to edit right away. To bring up the normal solarsystem menu you can double-click it.
Data Display
When opening a set's details the display options Node and Label will get activated automatically. You can display your data via Sectors or Tags aswell. Please select them via the data displays menu.
Sharing maps
Choose to share your map-data with your share-group or publically. Be aware that anybody will be able to view this dataset if you choose to make it public. Unticking the box will stop the data from updating the set for other people but will NOT delete it from other people's sets.
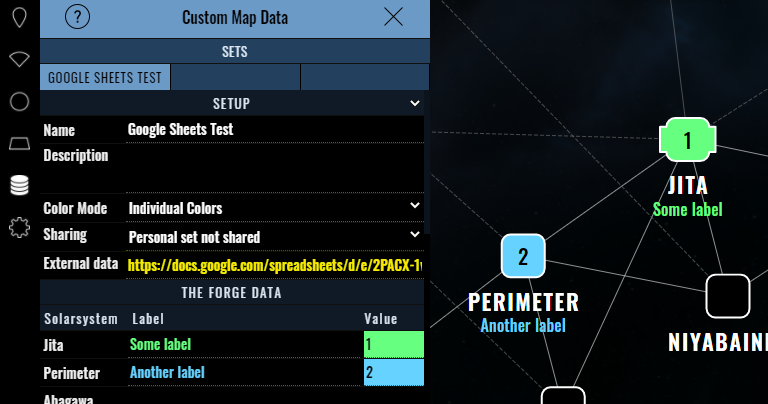
External Data
You can feed external data to eveeye by pasting an url to a JSON array, CSV or plain text file. If you are using this feature you won't be able to edit data within eveeye.
Data
The data file has to contain the following keys:
| key | description | type | max |
|---|---|---|---|
| ss | solarsystem name or id | string or numeric | - |
| lbl | label | string or numeric | 30 chars |
| val | value | string or numeric | 6 chars |
Either a label or value should be present with a solarsystem.
JSON Example
[{"ss":30004738,"val":1},{"ss":"Shenda","lbl":"Hello, "},{"ss":30004271,"lbl":"3","val":"World"}]
CSV / TXT Example
30004738,,1
Shenda,"Hello, "
30004271,3,World
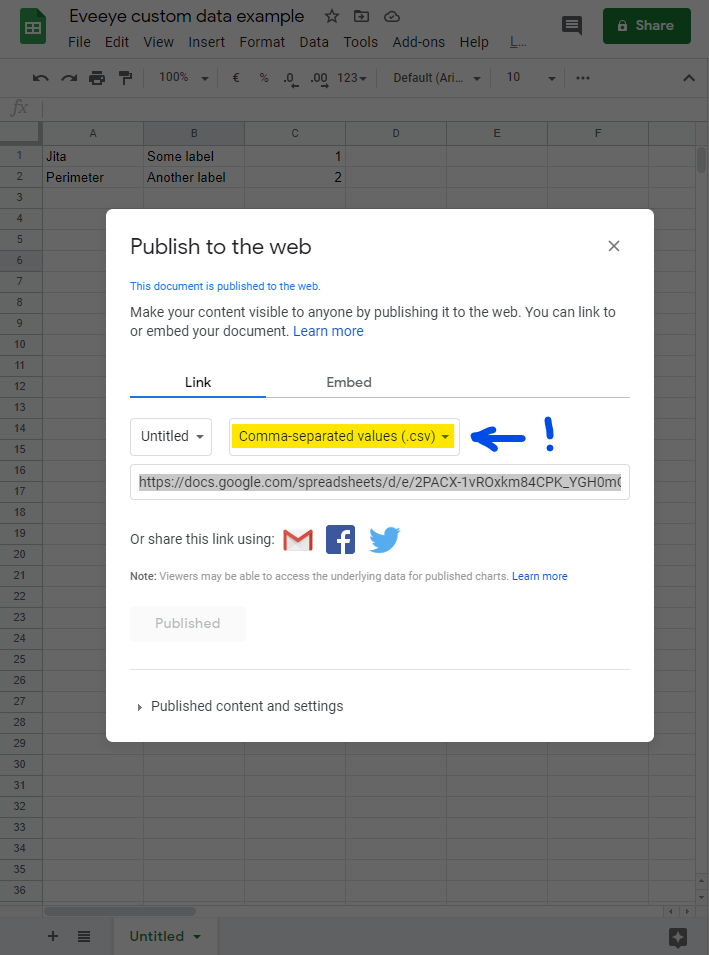
Google Sheets
You for example could use Google Sheets to maintain the data.
Using File > Publish to the web you can get the url to paste into the External data field:
Features are quite new. Feedback via Eveeye Discord please.