Activity graph
This graph shows activity within the solarsystem of the recent 48 hours.
Explanation
Its layout will show same hours of the day in the same column to easily check what activity may be expected the upcoming hours. The green NOW annotation shows the current hour of the day. Therefore the box to the left of the text NOW shows the most recent activity.
Time measures are Eve time (UTC).
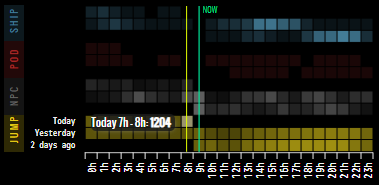
In the example above the time was between 8 and 9 o'clock. The most recent jumps recorded in that solarsystem were 1.204 jumps which occurred between 7 and 8 o'clock.
The system screenshot on a sunday was Niarja - a high-sec ganking sys. The last 2 days most ships were destroyed during 14 to 16 o'clock on saturday and 17 to 22 o'clock on friday.
K-Space systems
Will show JUMPs, NPCs destroyed, PODs killed and Player-SHIPs destroyed. Stats pulled from Eve API.
W-Space systems
Will show STRuctures destroyed, PODs killed and Player-SHIPs destroyed. Stats pulled from zKillboard API.
Structure stats include dockable structures, POS and deployable structures.
Color shading
Generally depends on the min and max of each series. The shading of POD and SHIP is in relation though since it is calculated from min and max of both series.